
Technology writer and academic, Zeynep Tufekci, once wrote:
In a way, modern microprocessors act like attentive butlers, pouring that second glass of wine before you knew you were going to ask for it.
Here, she was referring to a common trick that most CPUs now employ: anticipating what the program is about to do and start doing it before it has been asked to – for example retrieving data from memory. The result, of course, is increased speed and efficiency, which are two of the main metrics we've been testing and comparing during the last week or so.
In our recent bench marking exercise, we tested our new Melbourne-based cloud platform against offerings from Vultr, DigitalOcean, and AWS. The platforms' specs were as follows:
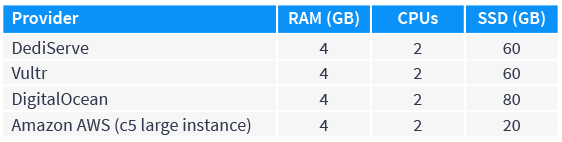
To see how our cloud platform stacks up against the mainstream competitors, we conducted five different tests in total – here's what we found:
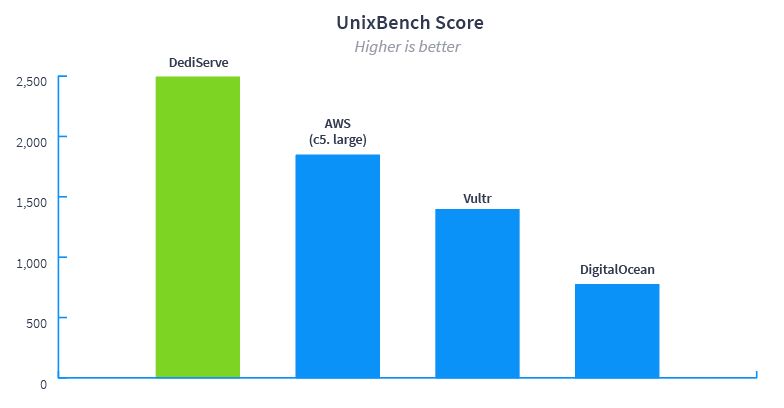
1. UnixBench
Running the UnixBench application provided us with a great overview, as it tests various aspects of server performance – including CPU, RAM, disk, I/O – and then gives an overall score. We were delighted with a result of 2491.5 –positioning us as the clear winner against other key industry players.

2. SSD Storage Read Speeds
After performing several runs, we came out with an average speed of 109,616 read operations per second – more than twice as fast as Vultr. It's these lightning speeds that ensure our customers' websites can run quickly, with near instant access times and high throughput.
-2.png?width=794&name=read%20operations%20(per%20second)-2.png)
3. SSD Storage Write Speeds
Our write speed, which tests revealed as 25,477 operations per second, makes our enterprise cloud perfect for intensive databases.
While DigitalOcean may employ impressive read cache technology to increase read I/O, the flip side is that write speed suffers – we found the provider's average speed to be less than half that of DediServe, at 11,062.
-3.png?width=786&name=write%20operations%20(per%20second)-3.png)
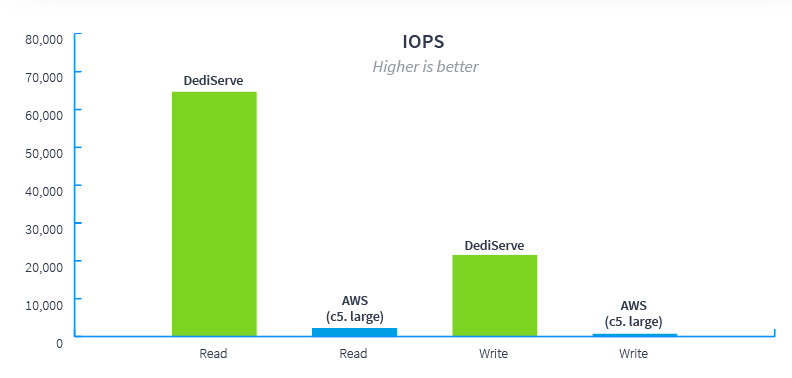
4. Combined Read and Write Speeds
Thanks to their restrictive storage model, AWS's I/O performance results provided the starkest contrast of all. In a real-world setting, a business could only hope to improve such low results by taking one measure: spending a lot more by purchasing much larger quantities of storage.
5. Deployments
In the time it's likely taken you to reach this point of the post, our cloud platform could be deployed. On average, it took 38 seconds to have a server ready for use from clicking "Build".
%20-3.png?width=783&name=Deployment%20time%20(seconds)%20-3.png)
Final Thoughts
There's one more important metric we'd love to benchmark, but – as the required data isn't publicly available – we can't. In an ideal world, we'd compare data for things like ticket backlog, resolution rate, and average first response time. Unfortunately, we can't provide you with customer support benchmarks, but we can tell you how we approach the area.
Our friendly team of experts provides comprehensive 24/7/365 support as standard. With round-the-clock monitoring and alerting, and a 15-minute maximum response time, we offer a fully-managed infrastructure service. It's this level of support that our customers comment on, time and time again.
To learn more, get in touch with the team today, or, if you're ready to get started, join the production-ready cloud today.